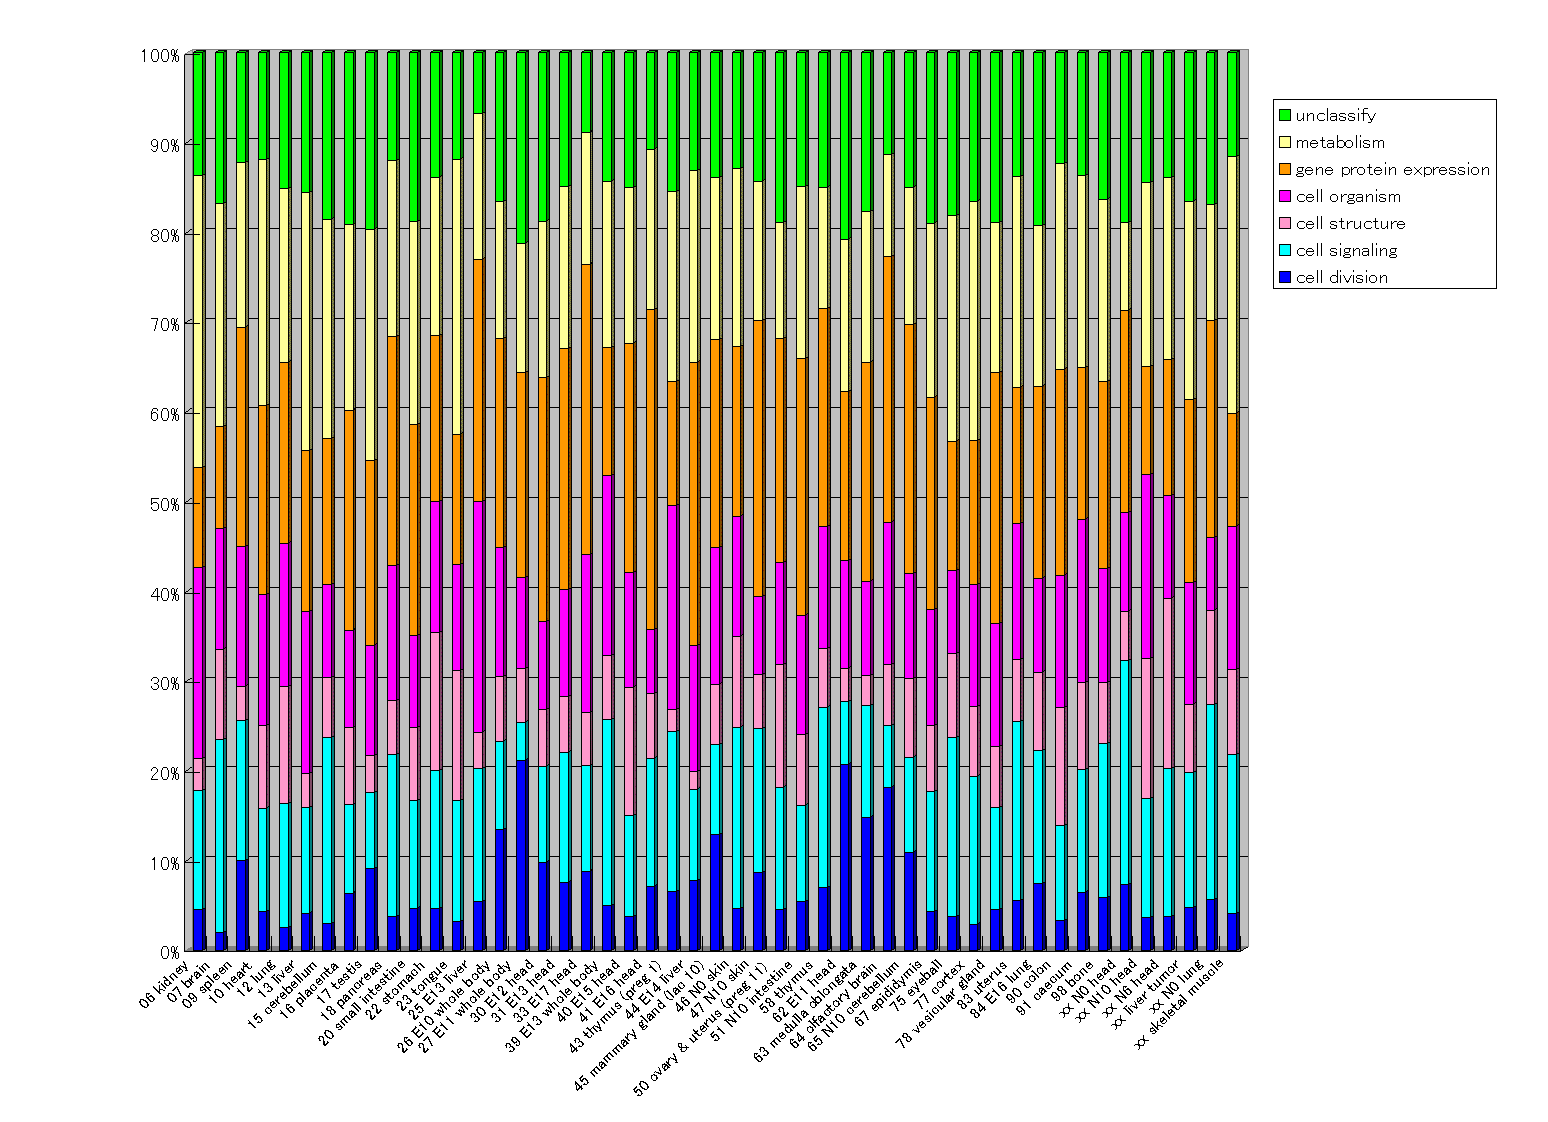
- Ratios of cellular roles for the 49 tissue samples.
- The number of genes that passed the filtering and the correlation coefficient value for the duplicated experiment of each sample. 19K genes set were printed in three multiblocks. The correlation coefficient value was calculated for duplicated experiment in each multiblock. Each multiblock contains 7,056 spots in which 768 genes were included as positive and negative controls.
- Histogram of log2 (Cy3-Cy3bg)/(Cy5-Cy5bg) for each tissue.
bg, background
- All pathway(txt,cdt,gtr files)
Supplementary for PNAS papers can be found here.